You and your team work tirelessly. Between hosting networking events, advocating for local businesses, driving tourism, and organizing ribbon cuttings, the daily work of a Chamber of Commerce or Convention & Visitors Bureau (CVB) is non-stop.
If your community’s success isn’t documented, it’s invisible. If you don’t tell your stakeholders what you did and the results of your work, they’ll never know.
Every Chamber and CVB should produce a clear, data-driven annual report. This report is more than just a recap of the last 12 months; it is one of your most powerful tools for demonstrating value, building trust, and proving that your organization delivers measurable results for your members, partners, and community.
Show The Impact of Your Work
A well-crafted annual report clearly demonstrates how you impacted your community, members, and economy in a way that all stakeholders can understand. Using data, you can inform your stakeholders about:
- what you accomplished
- how your work benefited members
- the benefit to the community
- why it is important to continue supporting your organization
When you showcase the wins your team delivered, you give businesses a compelling reason to stay engaged, renew memberships, attend events, and even invest at higher levels. Your annual report is a valuable asset for recruiting new members, attracting visitors, securing funding, and reinforcing your leadership in economic and destination development.
What to Include in an Annual Report
Your stakeholders want to see data – not just a description of an activity or event but the metrics that show the results. Throughout the year, you will need to track and record data for your events, such as attendance, volunteer hours, ticket sales, sales (for business-oriented sales events like a Sip and Shop), and more. For each event or activity, collect data related to the specific goal for that event.
For example, if you are hosting a membership training event, you would record the total number of attendees. If you are hosting an event to boost tourism, you would count attendees and collect sales tax and hotel occupancy tax data for that period. For the tourism event, you can include reach and engagement on social media as well as this shows the visibility of your community online.
Here are a few metrics to include in your annual report:
Member and Community Impact
- Member retention rate
- New member growth rate
- Increases in tourism-related businesses (retail, hospitality, etc)
- Advocacy done on behalf of businesses
- Number of ribbon cuttings, trainings, and networking events

Engagement and Reach
- Total number of promotional events
- No. attendees for each event
- Member participation/engagement rates
- Website analytics
- Social media metrics related to your goals
The Brass Tax
- City or county sales tax performance
- Economic impact of events
- Awards or recognitions received
- Ad campaign results
Track key metrics year over year and provide comparisons to show your progress. Present some of this information in graphs or charts to help show trends.
These data points don’t just highlight activity—they illustrate results. And results are precisely what members want to see.
And, of course, don’t forget the testimonials. Hearing about their experience with your organization from existing members carries a heavy weight with potential and other members.
Your Annual Report Builds Credibility
This report shows that your organization is transparent, delivers measurable outcomes, and is an important driving force in the community and local economy.
This report becomes a cornerstone of your marketing and recruitment strategy.
- Include it in new-member packets
- Share it at board and committee meetings
- Present it at annual meetings and investor briefings
- Send it to partners, funders, and local officials
- Repurpose its metrics for social media, email marketing, and sponsorship decks
- Use it as cornerstone content for membership recruitment and retention campaigns
The more you share it, the more people understand the value and impact of your work.
Let Your Success Speak for You
Your annual report is your opportunity to control the narrative. By documenting your wins, you ensure that your impact is seen, understood, and appreciated. Don’t let your hard work go unnoticed. Let a well-crafted annual report transform how the community views your organization.
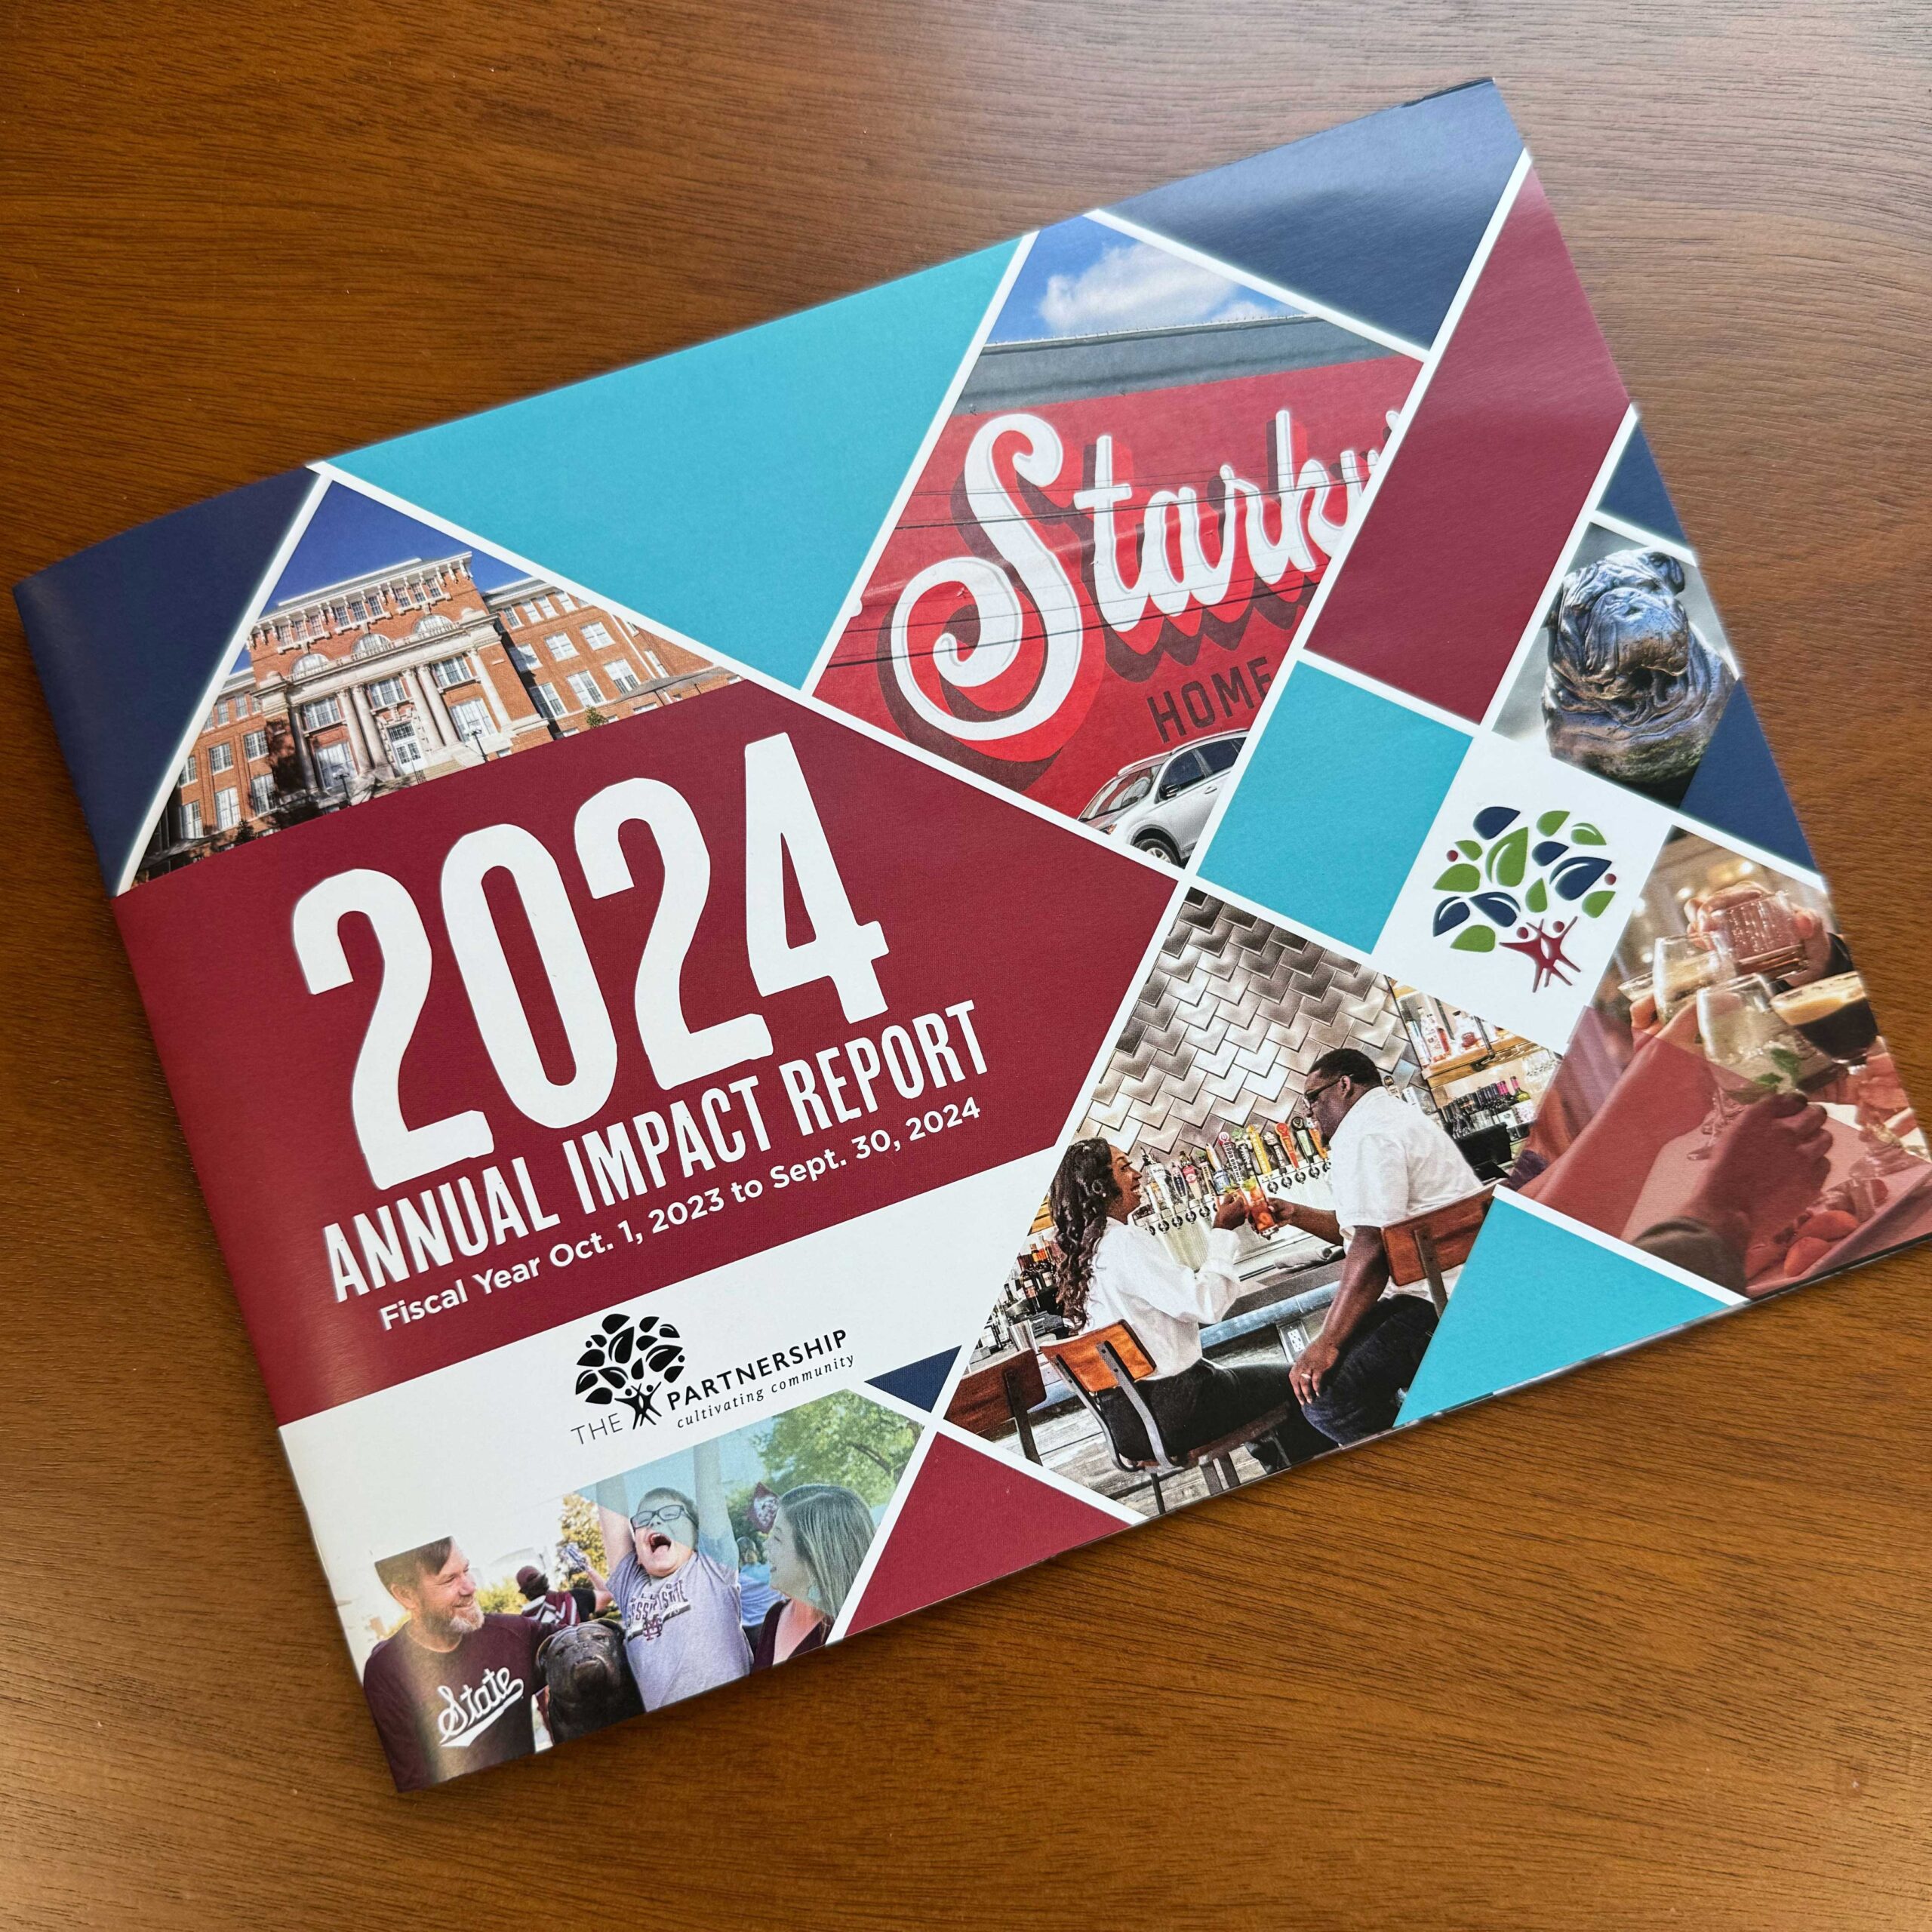
Our annual report clearly showcases our accomplishments and measurable impact, helping us attract and retain members who want to be part of a thriving organization benefiting Starkville. It also provides the credible proof of success that sponsors and donors look for, reinforcing our value and demonstrating exactly how their support strengthens our community.
Paige Watson, Greater Starkville Development Partnership
We Can Help You Tell Your Story
Compiling the data and designing a narrative that resonates can be a daunting task, but you don’t have to do it alone. We can help you create an amazing report that drives member retention and showcases your community’s growth.
Contact us today to get started on your annual report!